SQL Saturday Sydney #352 (2014)

SQL Saturday Sydney is back with lots of power packed sessions and a strong line up of speakers. I will be speaking on the topic “Crack open the AMO for SSAS Tabular” which will certainly help developers to programmatically manage and administer Analysis Services Tabular models.

Please find the agenda for the day (25th Oct, 2014) here.

sqlsat352

Venue: University of Sydney

Looking forward to seeing you there.

Qlik Sense Desktop – Querying Analysis Services Tabular Model

Qlik launched their new product Qlik Sense Desktop that officially marks the launch of their next generation platform. The Qlik community and practitioners had been waiting for Qlik.Next for a while and the launch of Qlik Sense Desktop marks the beginning of a new era for Qlik embracers.

A few months ago, I blogged about using Microsoft Analysis Services Tabular Model as a data source for Qlikview. As a practitioner of SQL Server Analysis Services (SSAS) Tabular Model, I was curious to find out if there was a native connector for SSAS in Qlik Sense Desktop.

The following steps describe the process of loading data from SSAS Tabular Model using Qlik Sense Desktop. As a pre-requisite, please ensure you have the necessary OLEDB drivers for SSAS (MSOLAP) installed on your desktop.

Step 1: In the ‘Data Load Editor’, click on ‘Create New Connection‘ and select OLEDB from the list of connections.

qliksense_oledb

Step 2: Select the provider for Analysis Services and enter the connection details to connect to the tabular model. Click Save once done.

qliksense_oledb_ssas

Step 3: Once the connection is successfully saved, it appears in the Data Connections pane on the right.

qliksense_oledb_ssasconnection

Step 4: Though the metadata can be viewed using the select data option, the OLEDB provider for SSAS cannot programmatically generate DAX queries. To extract data from the Tabular Model connection created in the previous step, DAX queries should be written in the data load editor as below.

qliksense_oledb_testdata

The verdict is that there are subtle differences in the interface but there is no native SSAS connector in Qlik Sense desktop yet. There are major enhancements in the visualisation side of things and I’m sure a lot of us will be talking about them in the coming days.


Twitter Analysis in Tableau Desktop

This post shows a quick twitter analysis dashboard that I created using Tableau Desktop. This dashboard is built on a dataset that was extracted from Twitter today (12 March 2014). This is a sample dataset that was extracted for the search term “MH370”. (Click on the image for enlarged size)

Image

What story does this dashboard tell us? What analysis can be drawn out of this sample visualisation? Here are some of the observations I could immediately draw from this dashboard.

1. Maximum tweets are in English language followed by Thai (which is obvious and evident from the top left part).

2. There has been a steep increase in tweets between 4 – 5 PM and when I drilled down to the details / content in tweets, I found out that this was the time when some of the popular news channels published their breaking news on twitter. This exponentially grew in numbers as more and more people retweeted the breaking news.

3. I could hover over the map and find out which country / city had higher tweets than others and what patterns of tweets (texts / content) were coming from different parts of the world.

4. Finally, the maximum tweets had the hashtag “MH370” followed by “PrayForMH370”.

This sample exercise was done to simply leverage the capabilities of Tableau to analyse social media data from Twitter. The result is evidently a visualisation of meaningful information from raw tweets on a given topic.

Happy Halloween – Power Map

We were excited to see 3D geo-spatial visualisations when Microsoft launched the preview of GeoFlow earlier this year. GeoFlow, which is now renamed PowerMap, allows us to create and uplaod videos.

Taking customers through a journey and walking through data visualisation stories can’t get any easier. Please see below for an amazing post (and video) of what I’m talking about.

Halloween visualisation with Power Map

Happy Halloween!

Querying SSAS Tabular Model from QlikView using DAX – 3 Simple Steps

QlikView does not have the ability to natively query SSAS cubes (both Multidimensional and Tabular). But it allows you to query SSAS using the Microsoft MSOLAP driver. The primary motive behind this post is the lack of material or content online about sourcing data from SSAS Tabular using DAX (SQL Server 2012). One could write MDX queries and extract data from SSAS Tabular, but that results in hours if not days for the query to execute and load a large dataset into a QlikView Data file (or QlikView Workbook).

For more information on connecting to SSAS with MDX queries, please refer to this QlikCommunity thread.

The following section is a 3-step simple tutorial to successfully query and extract data from a deployed SSAS Tabular model (In-Memory cube).

The pre-requisite to issue DAX queries from QlikView is to install the latest MSOLAP driver from here.

Step 1: Write the following connection string to conenct to the SSAS Tabular database.

OLEDB CONNECT TO [Provider=MSOLAP;Integrated Security=SSPI;Persist Security Info=False;Initial Catalog=<CubeName>;Data Source=<AnalysisServicesInstance>;Location=<AnalysisServer>]

where

  • <CubeName> – Name of SSAS Tabular database;
  • <AnalysisServicesInstance> – Name of SSAS Instance;
  • <AnalaysisServer> – Name of server where SSAS is running

Step 2: Write the relevant DAX query to extract data. For simplicity, the following code extracts data from a table named “GeoCodes”.

GeoCodes:
SQL
evaluate('GeoCodes');
STORE GeoCodes INTO D:\QVSource\QVD\GeoCodes.qvd;
DROP TABLE GeoCodes;

Step 3: Debug or Run the script to execute and load data into a QVD file.

MSOLAP_DAX

I hope you found this useful. Try playing with advanced DAX queries and you’ll be surprised with the results.

TFS 2013 – Agile Portfolio Management

Brian Harry announced the launch of TFS 2013 to be scheduled at Build conference this year and some of the features are included for Preview in Team Foundation Service. I have been using Team Foundation Service for my talks at SQL Saturdays on “Agile BI” and noticed the new changes well ahead of my presentation for SQL Saturday #226 in South Florida.

This post is to introduce some of the new features that have been built into TFS 2013 in relation to the Agile Portfolio Management or Epics as Adam Cogan states in his blog.

The first thing you would notice in the Backlog page are the different levels of backlog. This is clearly to distinguish the granularity of a feature / task for diferrent people in an organisation. A business stakeholder would be more interested in a feature that is being developed while a business analyst would be keen to track the progress of user stories. Also notice the colour coding that has been used for different levels of backlog which makes it even more easier to track the work items.

TFS 2013 - Feature-Stories

On the top right corner, drilldown view options (from features to stories to tasks) are available for selection. This allows you to add user stories under features (or) tasks under user stories from the same page (Notice the green plus sign next to the feature / user story)

TFS drilldown

TFS plus

Board supports all levels of backlog and allows you to track the items under features and user stories separately (The same colours are used for items on the board).

TFS Board

On the TFS Dashboard page, there is a new addition of the Team Rooms tile by default. I will post more about Team Rooms after I try it out with the official release of TFS 2013.

TFS dashboard

Happy Stories!

SSAS Tabular Model – Validate partition query bug

I encountered this unexpected bug while creating multiple partitions for a table in my SSAS Tabular model. While authoring the model in SSDT (Visual Studio 2010), I created two partitions for a given table to split the processing for a large dataset. After entering the query for the second partition, the validation check failed with the error “Object reference not set to an instance”.

There is a Microsoft Connect bug opened for this issue here.

You can also read more about this on the Technet thread here.


SQL Saturday #226 in South Florida, USA

I am excited yet again as I will be speaking at SQL Saturday #226 in sunny South Florida, USA. I will be speaking in the BI and Reporting Track in the afternoon. If you are from the South Florida region, please don’t miss out on this exclusive training day on everything SQL Server.

The event schedule is listed here.

sqlsat226

Cheers.

Update: I had a great time speaking at Fort Lauderdale, Florida. Below is a farewell photo with other speakers (happy faces)

SQL Saturday South Florida Speakers

Speaking at SQL Saturday #224 – Sydney 2013

I am excited about speaking in my residential city of Sydney for SQL Saturday #224 on 25 May, 2013. I am extending the presentation I did for SQL Saturday #210 in Brisbane last month (Agile BI with SQL Server 2012 and TFS 2012). I am looking forward to seeing my mates from the Sydney BI community.

SQLSat224

Please register if you haven’t done already.

The event will be held at:

Epping Boys High School (EBHS),
213 Vimiera Road
Eastwood, NSW, 2122
Australia

The schedule for the day is put up here.

Statistical Median with T-SQL (2012)

I have been interacting with my statistician colleagues lately and there was a reporting requirement to calculate medians over a spread of continuously distributed values. Thankfully with SQL Server 2012, you do not have to use the ROW_NUMBER() function as you had to with earlier T-SQL versions.

PERCENTILE_CONT and PERCENTILE_DISC are now available in T-SQL 2012. According to the SQL BOL, these functions are described as:

PERCENTILE_CONT: Calculates a percentile based on a continuous distribution of the column value in SQL Server 2012. The result is interpolated and might not be equal to any of the specific values in the column.

PERCENTILE_DISC: Computes a specific percentile for sorted values in an entire rowset or within distinct partitions of a rowset in SQL Server 2012. PERCENTILE_DISC calculates the percentile based on a discrete distribution of the column values; the result is equal to a specific value in the column.

Let us put these functions to test and understand them a bit more in detail:

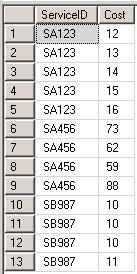
I have a sample table(ServiceCost) with ServiceIDs (that will be the data element to group by) and Cost (the field for which medians have to be calculated).

MedianSampleTable

I calculated the medians using PERCENTILE_CONT and PERCENTILE_DISC as below:

</code>

SELECT DISTINCT ServiceID,

              PERCENTILE_CONT(0.5) WITHIN GROUP (ORDER BY Cost)

              OVER (PARTITION BY ServiceID) AS MedianValue,

              PERCENTILE_DISC(0.5) WITHIN GROUP (ORDER BY Cost)

              OVER (PARTITION BY ServiceID) AS MedianDisc

  FROM ServiceCost

  order by ServiceID<code>


The result of this query is:

MedianOutputTable

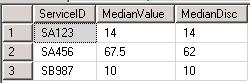
The difference between the way these two functions work is clear from the output for ServiceID: SA456. The PERCENTILE_CONT function calculated the mean of the values {62,73} to result in 67.5; while the PERCENTILE_DISC function resulted in the value 62 which is one of the column values in the data set.

We can now show off the power of T-SQL for statistical analysis… Hurray!